Analytics
How to use Event Vault's analytics to track engagement and measure event success.
Event Vault provides a built-in analytics dashboard to help you understand how attendees are engaging with your event — in real time during the event and after it concludes.
Accessing Analytics
Go to the Analytics section in the Management Console for your event. The dashboard is organised into sections covering overall activity, sessions, speakers, sponsors, and networking.
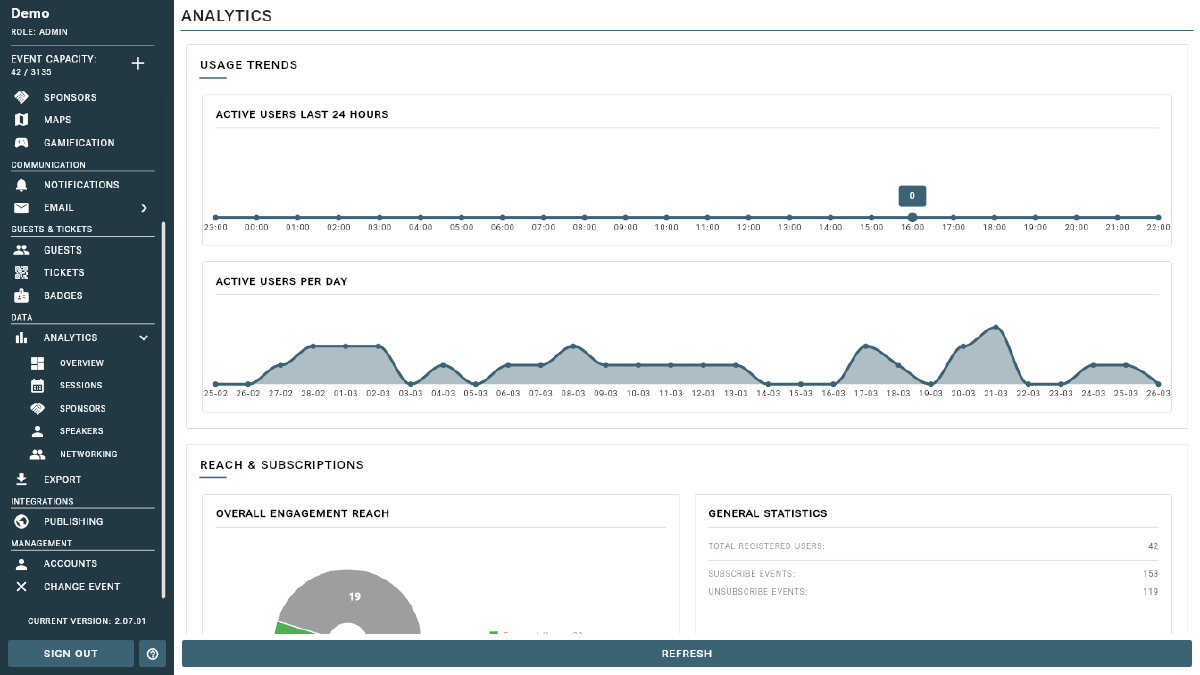
Overview Dashboard
The top-level dashboard gives you a snapshot of overall event engagement:
- Active Users — the number of users active in the last 24 hours, plus a per-day activity chart showing engagement over time.
- Registered Users — the total number of guests who have completed registration.
- Subscribe / Unsubscribe Events — how many guests have joined or left the event over time.
- Overall Engagement Distribution — a breakdown of all engagement types (views, bookmarks, Q&A activity, networking, etc.) across your entire event.
Session Analytics
Click into Sessions analytics to see detailed engagement for your event schedule:
- Session view trends over time (last 24 hours or per day)
- Which sessions are generating the most engagement
- Session Reach — how many unique users viewed each session
- Action Distribution — a breakdown of views, bookmarks, Q&A activity, and other interactions per session
- Session Affinity — which sessions attendees tend to view together, useful for understanding audience interest clusters
Speaker Analytics
- Speaker view trends over time
- Top speakers ranked by engagement
- Speaker Reach metrics showing how many unique attendees viewed each speaker’s profile — useful for post-event reporting to speakers and for evaluating speaker impact.
Sponsor Analytics
- Carousel Impression Counts — how many times each sponsor’s banner was displayed
- Sponsor Link Click-Through Rates — how many attendees clicked through to a sponsor’s website
- Overall sponsor engagement summary — share these metrics with your sponsors as proof of value and return on investment.
Networking Analytics
- Active networking users
- Chat activity volume and trends
- Networking action distribution — profile views, connection requests, and other networking interactions
Drilling Down
Click on any session, speaker, or sponsor in their respective analytics views to see a detailed breakdown for that specific item. Each detail view includes:
- A usage trend chart showing engagement over time
- A full action breakdown for that item
Tip
Analytics data updates in near real-time. Use session analytics to identify popular content and networking analytics to measure engagement quality.
Tips
- Share sponsor analytics with your sponsors post-event to demonstrate ROI and strengthen future sponsorship relationships.
- Use session engagement data to identify your most popular topics and speakers — this helps you plan stronger content for future events.
- Monitor active users during the event to gauge live participation and identify if attendance is dropping off.